 |
|
|
|
|
|
|
|
|
|
|
|
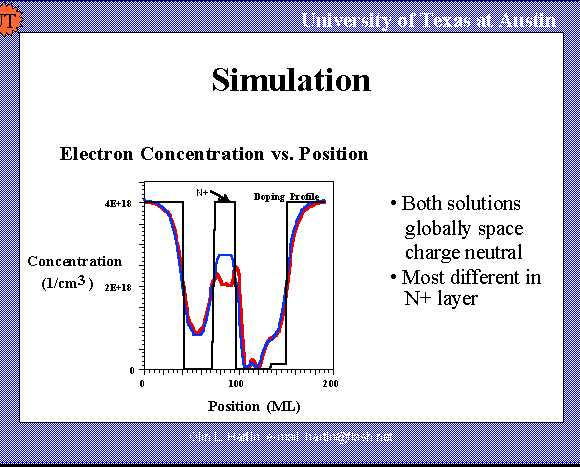
This graph shows electron concentration vs. position in the device for two solutions. The doping profile is shown in black. The heterostructure quantum well is at position 105 through 120. The largest difference in concentration between the two solutions is in the N+ doped layer. Devices without this layer do not demonstrate the switching phenomenon. Both curves are global space charge neutral.